Caption
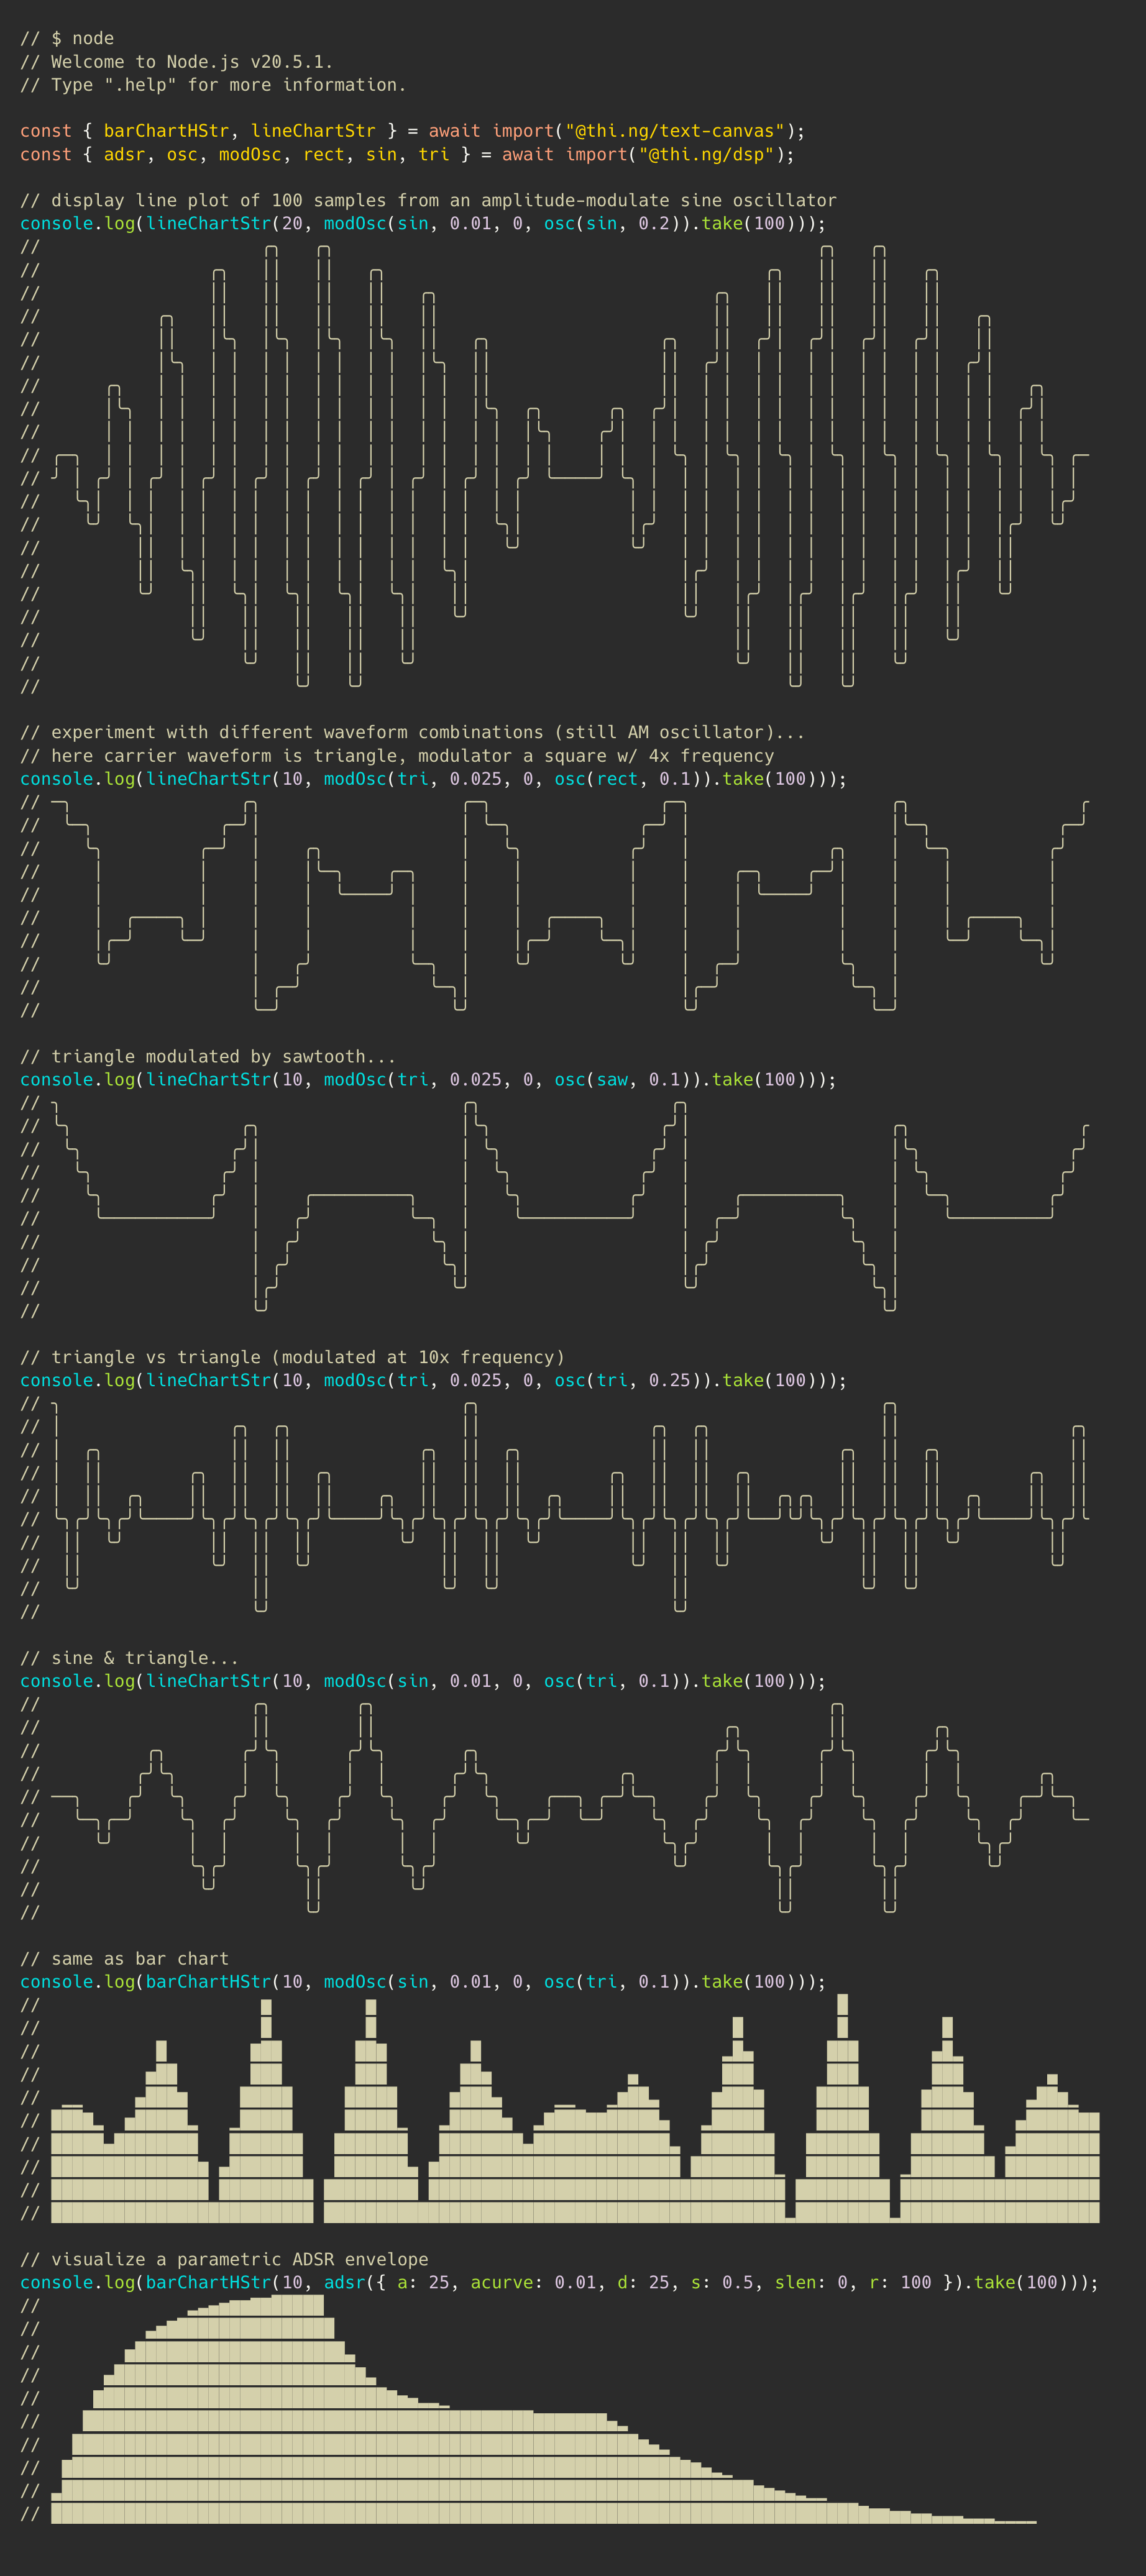
Good Morning & welcome to #HowToThing #004 — Painlessly creating text-based plots to debug & visualize sequential data in a REPL-driven workflow. Here we're using https://thi.ng/dsp signal generators, but _any_ numeric array or iterable will work. Visualization via https://thi.ng/text-canvas (new versions of both packages have just been released...)Source code:https://gist.github.com/postspectacular/66d6b7c19612196c87cead5a6afd681d#ThingUmbrella #TypeScript #JavaScript #AsciiArt #DataViz #DSP #Tutorial